NIFTY 50 ANALYSIS :
As we all are very well known about USA tariff threat, so the indian stock market facing some continuous selling pressure in last two months. If we look at our market , Indian indices didnot react much negetively despite all the tariff tantrum and continuous selling by FIIs.
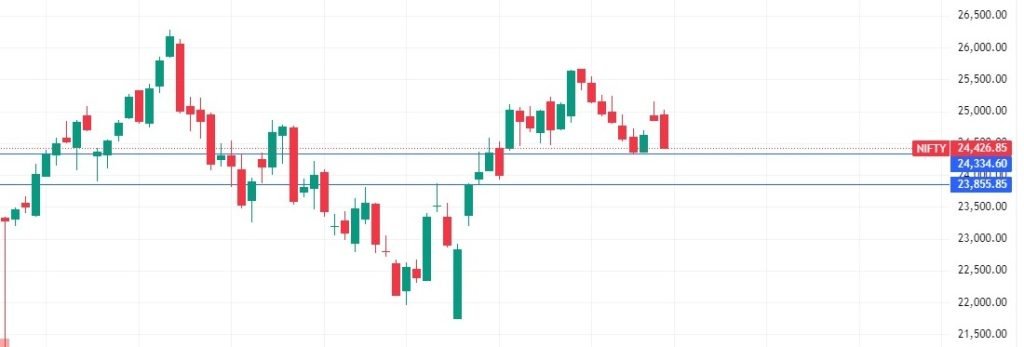
As shown on the chart from last nine weeks the nifty 50 index is forming red candles , but the fall is not brutal one. Index is coming down slowly and gradually. This fall was anticipated by me in mid june when the index was approaching 25000 mark . I clearly told in advance many times in my instagram reels about the resistance and profit booking near resistance zone of 25000-26000 levels . So it is not new and sudden dip for me and my followers .
I am always trying to avoid the noise and analyse indices properly without any biased view. After 4000 points of one sided two month rally , this dip was very much likely on the charts.
According to my limited knowledge, most of the indian indices are near their strong support zones or in oversold zones, so hopefully this dip will be over soon.
The nifty 50 index weekly support zones as per current scenario are mentioned on the charts i.e around 24340 and 23850.
So my advise to stock market participants is to avoid the noise and do not fall in the trap to sell at lower levels . For a healthy runup , dip is also neccessary. These ups and downs will always be there in the markets. Intelligent investors always take benifits of the fall .
निफ्टी 50 विश्लेषण:
जैसा कि हम सभी अमेरिकी टैरिफ के खतरे से भली-भांति परिचित हैं, भारतीय शेयर बाजार पिछले दो महीनों से लगातार बिकवाली के दबाव का सामना कर रहा है। अगर हम अपने बाजार पर नज़र डालें, तो टैरिफ के तमाम झंझटों और विदेशी संस्थागत निवेशकों (एफआईआई) की लगातार बिकवाली के बावजूद भारतीय सूचकांकों ने ज़्यादा नकारात्मक प्रतिक्रिया नहीं दी।
जैसा कि पिछले नौ हफ़्तों के चार्ट पर दिखाया गया है, निफ्टी 50 सूचकांक लाल कैंडल बना रहा है, लेकिन यह गिरावट बहुत ज़्यादा नहीं है। सूचकांक धीरे-धीरे नीचे आ रहा है। इस गिरावट का अंदाज़ा मुझे जून के मध्य में ही हो गया था, जब सूचकांक 25,000 के स्तर के करीब पहुँच रहा था। मैंने अपने इंस्टाग्राम रील्स में 25,000-26,000 के स्तर के प्रतिरोध क्षेत्र के पास प्रतिरोध और मुनाफ़ावसूली के बारे में कई बार पहले ही स्पष्ट रूप से बता दिया था। इसलिए यह मेरे और मेरे फ़ॉलोअर्स के लिए कोई नई और अचानक गिरावट नहीं है।
मैं हमेशा शोरगुल से बचने और बिना किसी पूर्वाग्रह के सूचकांकों का सही विश्लेषण करने की कोशिश करता हूँ। दो महीने की एकतरफ़ा 4000 अंकों की तेज़ी के बाद, चार्ट पर यह गिरावट पूरी तरह से संभावित थी।
मेरे तकनीकी विश्लेषण के अनुसार, ज़्यादातर भारतीय सूचकांक अपने मज़बूत सपोर्ट ज़ोन के पास या ओवरसोल्ड ज़ोन में हैं, इसलिए उम्मीद है कि यह गिरावट जल्द ही खत्म हो जाएगी।
वर्तमान परिदृश्य के अनुसार, निफ्टी 50 इंडेक्स के साप्ताहिक सपोर्ट ज़ोन चार्ट पर दर्शाए गए हैं, यानी लगभग 24340 और 23850।
इसलिए शेयर बाज़ार के प्रतिभागियों को मेरी सलाह है कि वे शोरगुल से बचें और निचले स्तरों पर बिकवाली के जाल में न फँसें। एक स्वस्थ तेज़ी के लिए, गिरावट भी ज़रूरी है। बाज़ार में ये उतार-चढ़ाव हमेशा बने रहेंगे। समझदार निवेशक हमेशा गिरावट का फ़ायदा उठाते हैं।
Very good analysis and advice
thanx